Algorooms, Algo Trading Dashboard
Algo Trading Dashboard Case Study
I pulled strategy building, backtesting, live deployment and broker reporting into one dashboard, for traders who had been running all four in separate tabs.
About Algorooms
Algorooms is an algorithmic trading platform built for Indian retail traders. It lets them assemble equity, futures and options strategies from no-code templates, backtest them against historical data, forward and paper trade them, then deploy live across up to five connected brokers, with TradingView chart execution and broker-wise reporting in the same dashboard. This case study covers the redesign of that build, test and deploy chain.
algorooms.com
The problem
Algorooms' pitch was to end the spreadsheet-plus-charts-plus-broker-window habit, and it did hold the whole build–test–deploy chain in one product. But each stage assumed knowledge the previous one never taught, and traders stalled between reading a backtest and trusting it enough to go live.
User pain
- Setup demanded parameter decisions before a trader knew what they affected.
- Backtest results across runs were dense and near-impossible to compare.
- Nothing explained why a live order did or did not trigger.
Business pain
- Traders abandoned before ever reaching a live deployment.
- Support tickets clustered around parameter validation.
- TradingView execution and multi-broker support were strengths users never reached.
Product gap
- Builder, backtester and deployer carried disconnected logic.
- No guided defaults for the common index-options setups traders came for.
- Forward and paper deployment were not positioned as the step before going live.

What I owned
Owned
- Strategy builder: the four guided blocks and the advanced layer under them
- Backtest scorecard with benchmark and previous-run comparison
- The simulator gate between a passing backtest and a live deployment
- Execution log: why an order did or did not trigger
Collaborated
- Engineering on multi-broker connection states and order routing
- PM on plan limits: strategy count, backtest credits, brokers allowed
Out of scope
- The backtest engine and its historical data
- Broker integrations and the TradingView chart embed
- Anything inside the RA Algos section
The results
34%
faster strategy setup
41%
improved backtest completion
-29%
fewer parameter errors
Traders ran build, backtest and live deploy without leaving one dashboard. The build-test-deploy chain finally behaved as a single workflow. Consolidation became the reason to stay, not just the pitch.
The approach
I worked backwards from the deployment decision: what a trader has to believe before risking real capital, and which earlier screens are responsible for supplying that belief.
Mapped the tab-switching
Traced what traders were doing outside the product (spreadsheet, chart, broker window) and where the thread broke.
Blocked the builder
Reduced the parameter form to four questions a trader could already answer, with the rest one layer down.
Gave results a benchmark
Framed every backtest against an index and against the trader's own previous run.
Gated the deploy
Put the simulator between a passing backtest and real capital.
Before the pixels
The boxes-and-arrows stage. Each of these settled a question the finished screens no longer show you was ever open.
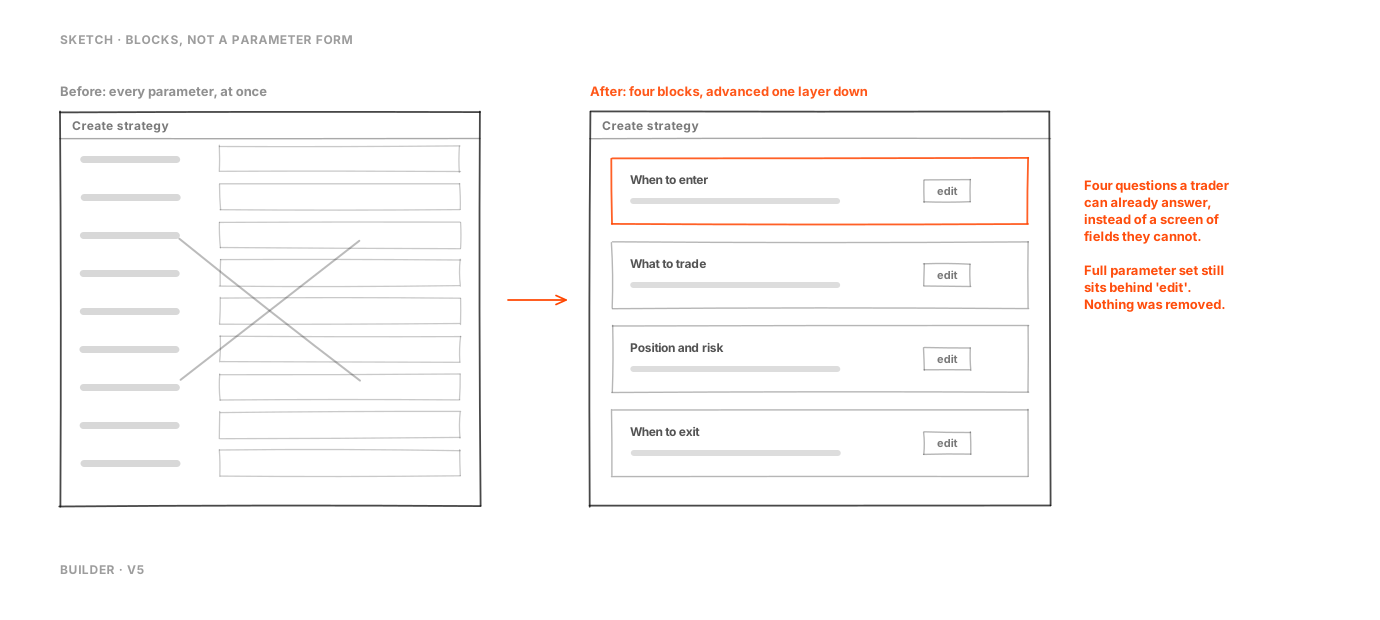
Blocks, not a parameter form
A screen of parameters became four questions a trader can already answer. Nothing was taken away. The full parameter set still sits behind each block's edit.
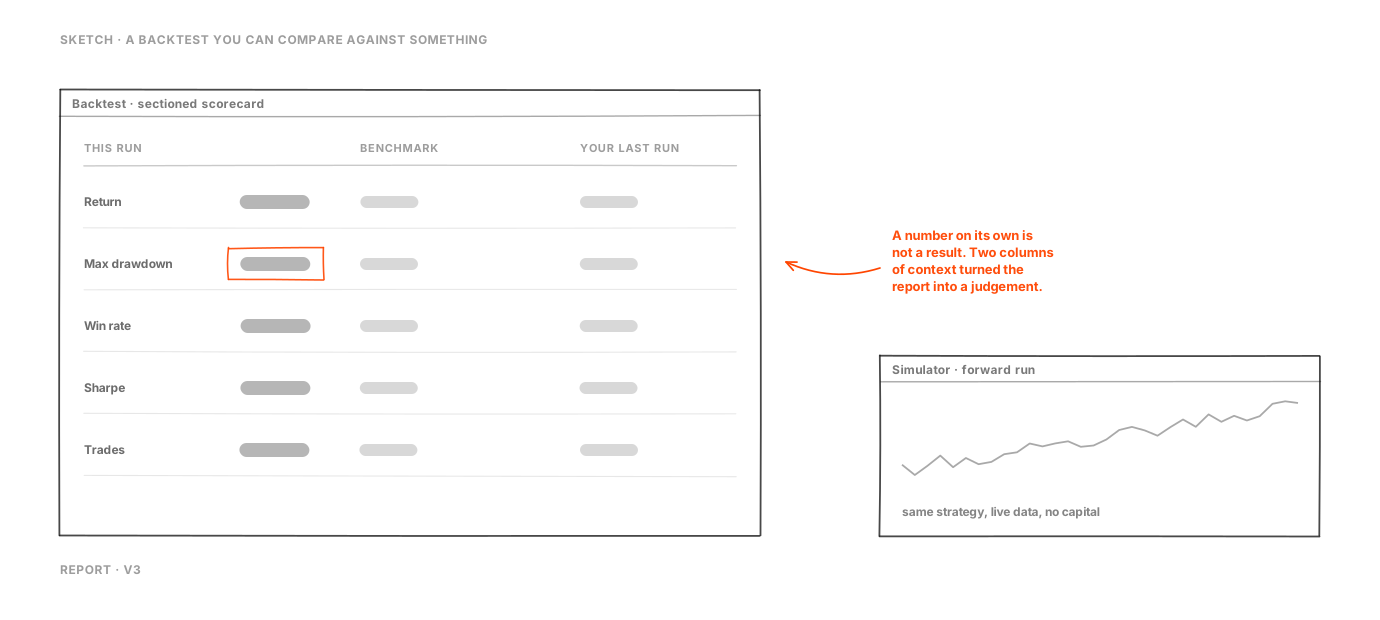
A backtest you can compare against something
A number on its own is not a result. Two columns of context, an index and the trader's last run, turned the report into a judgement.
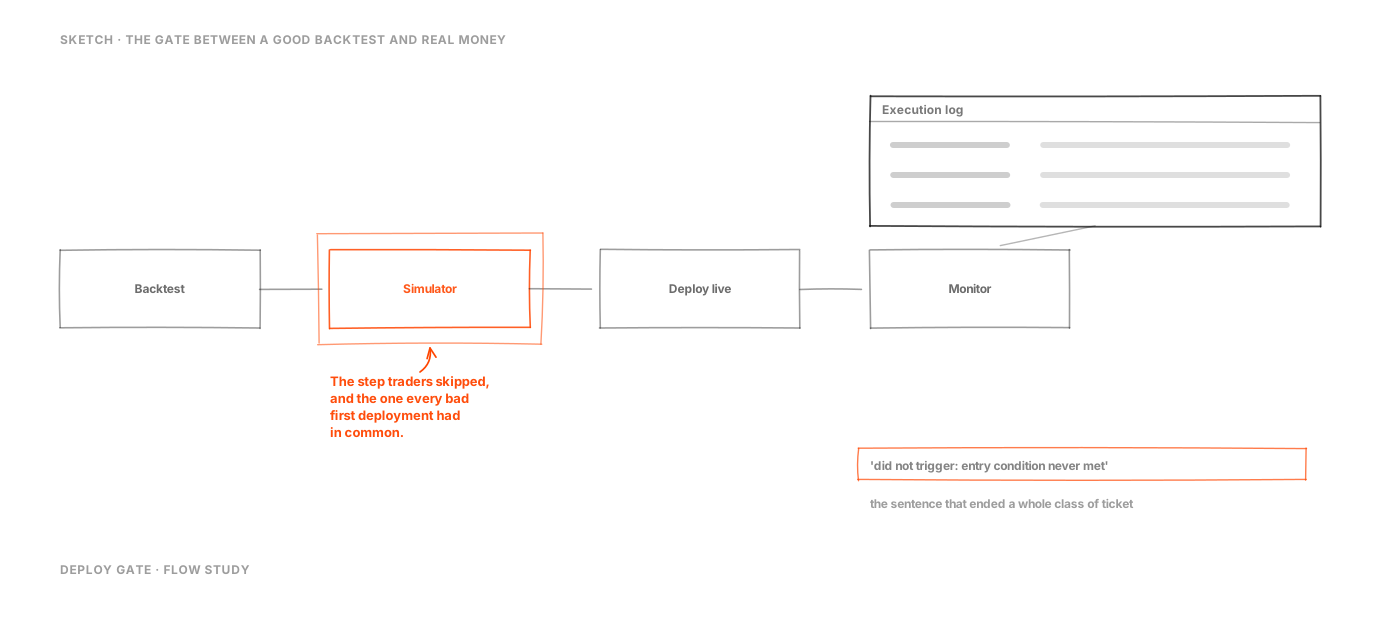
The gate between a good backtest and real money
The simulator was the step traders skipped, and the one every bad first deployment had in common. The execution log is what made monitoring worth opening.
The decisions
The calls that shaped the product, with what each one cost. Anything crossed out here was a real option at the time.
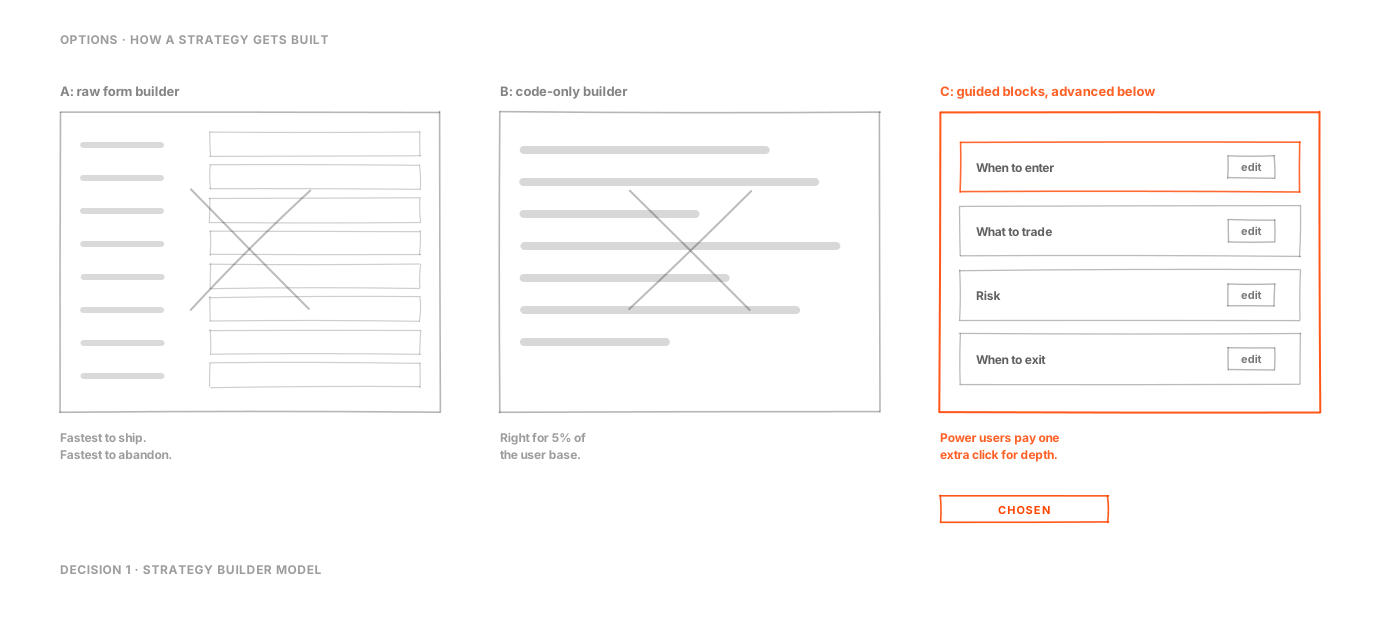
Decision 1: Strategy builder model
Traders could describe the setup they wanted and not the parameters it needed.
Considered
- Raw form builder
- Guided blocks
- Code-only builder
Chose
Guided block-based setup with progressive advanced controls
Gave up
Power users need one extra click for deep settings
On what evidence
Observed confusion around parameter dependencies in index-options setups
What happened
Setup time reduced by 34%
Decision 2: Backtest readability
Traders could read a backtest and still not judge the strategy quickly.
Considered
- Single long table
- Sectioned scorecards
- Chart-only report
Chose
Sectioned scorecards with benchmark comparison
Gave up
Higher information architecture complexity
On what evidence
Traders asked for plain-language performance summaries
What happened
Backtest completion improved to 62%
Decision 3: Deployment gate
Traders went live without a forward-deployed run behind them.
Considered
- Direct live deploy
- Readiness checklist with a forward-deploy step
- Warning modal only
Chose
Readiness checklist gated on a forward-deployed run
Gave up
Adds one mandatory review step
On what evidence
Error incidents mapped to skipped validation steps
What happened
Parameter errors reduced by 29%
The work
Guided defaults carry a first-time trader through strategy setup, with the full parameter set one layer down for those who want it. Backtest output is framed comparatively, against a benchmark and against the trader's own earlier runs, instead of reported raw.

Strategy workspace
Guide setup from intent to executable logic.

Monitoring dashboard
Track live behavior and confidence in one place.

Backtest review
Turn raw outcomes into go/no-go decisions.
Targets, set up front
Metric
Baseline
Target
Result
Measured in
Strategy setup time
Baseline 17 min
Target <12 min
Result 11.2 min
usability run
Backtest completion
Baseline 44%
Target 60%+
Result 62%
pilot users
Parameter error rate
Baseline 31%
Target <24%
Result 22%
validation logs
Outcomes in detail
Faster experimentation loops
More users reach decision stage
Lower support and risk exposure
Reflection
What worked
Guided blocks with the full parameter set one layer down served both ends of the room.
What to improve
Bring broker-wise reporting into the same view as strategy performance.
Next experiment
Make a forward-deployed run the default gate before any live deployment.


Vinit Chaudhary

I'll personally review your brief and get back to you within two hours.
Product Designer
Contact
I usually respond to all digital enquiries within 2 business hours.

Let's Work Together.
Reach out today and let's craft designs that elevate your brand to the next level.