ChartingHQ, Trading Analytics Platform
Trading Analytics Platform Case Study
I unified fragmented charting and analysis workflows into one decision-ready dashboard for active traders.
About ChartingHQ
ChartingHQ is a trading analytics platform that pulls charting, connected broker accounts and performance reporting into one workspace. This case study covers how those fragmented tools were unified into a single decision-ready dashboard for active traders.

The problem
ChartingHQ's traders were moving between charts, broker screens and their own spreadsheets to answer a single question, and losing the thread of the analysis on every switch.
User pain
- Users switched between charts, broker panels, and notes to make one decision.
- Signal context was visible but not actionable in same moment.
- High visual density made priority scanning difficult.
Business pain
- Fragmented workflows reduced feature adoption depth.
- Lower confidence delayed trading actions.
- Complexity increased onboarding burden for new users.
Product gap
- No unified hierarchy connecting signal, context, and action.
- Critical metrics lacked semantic grouping.
- Interaction states were inconsistent across modules.
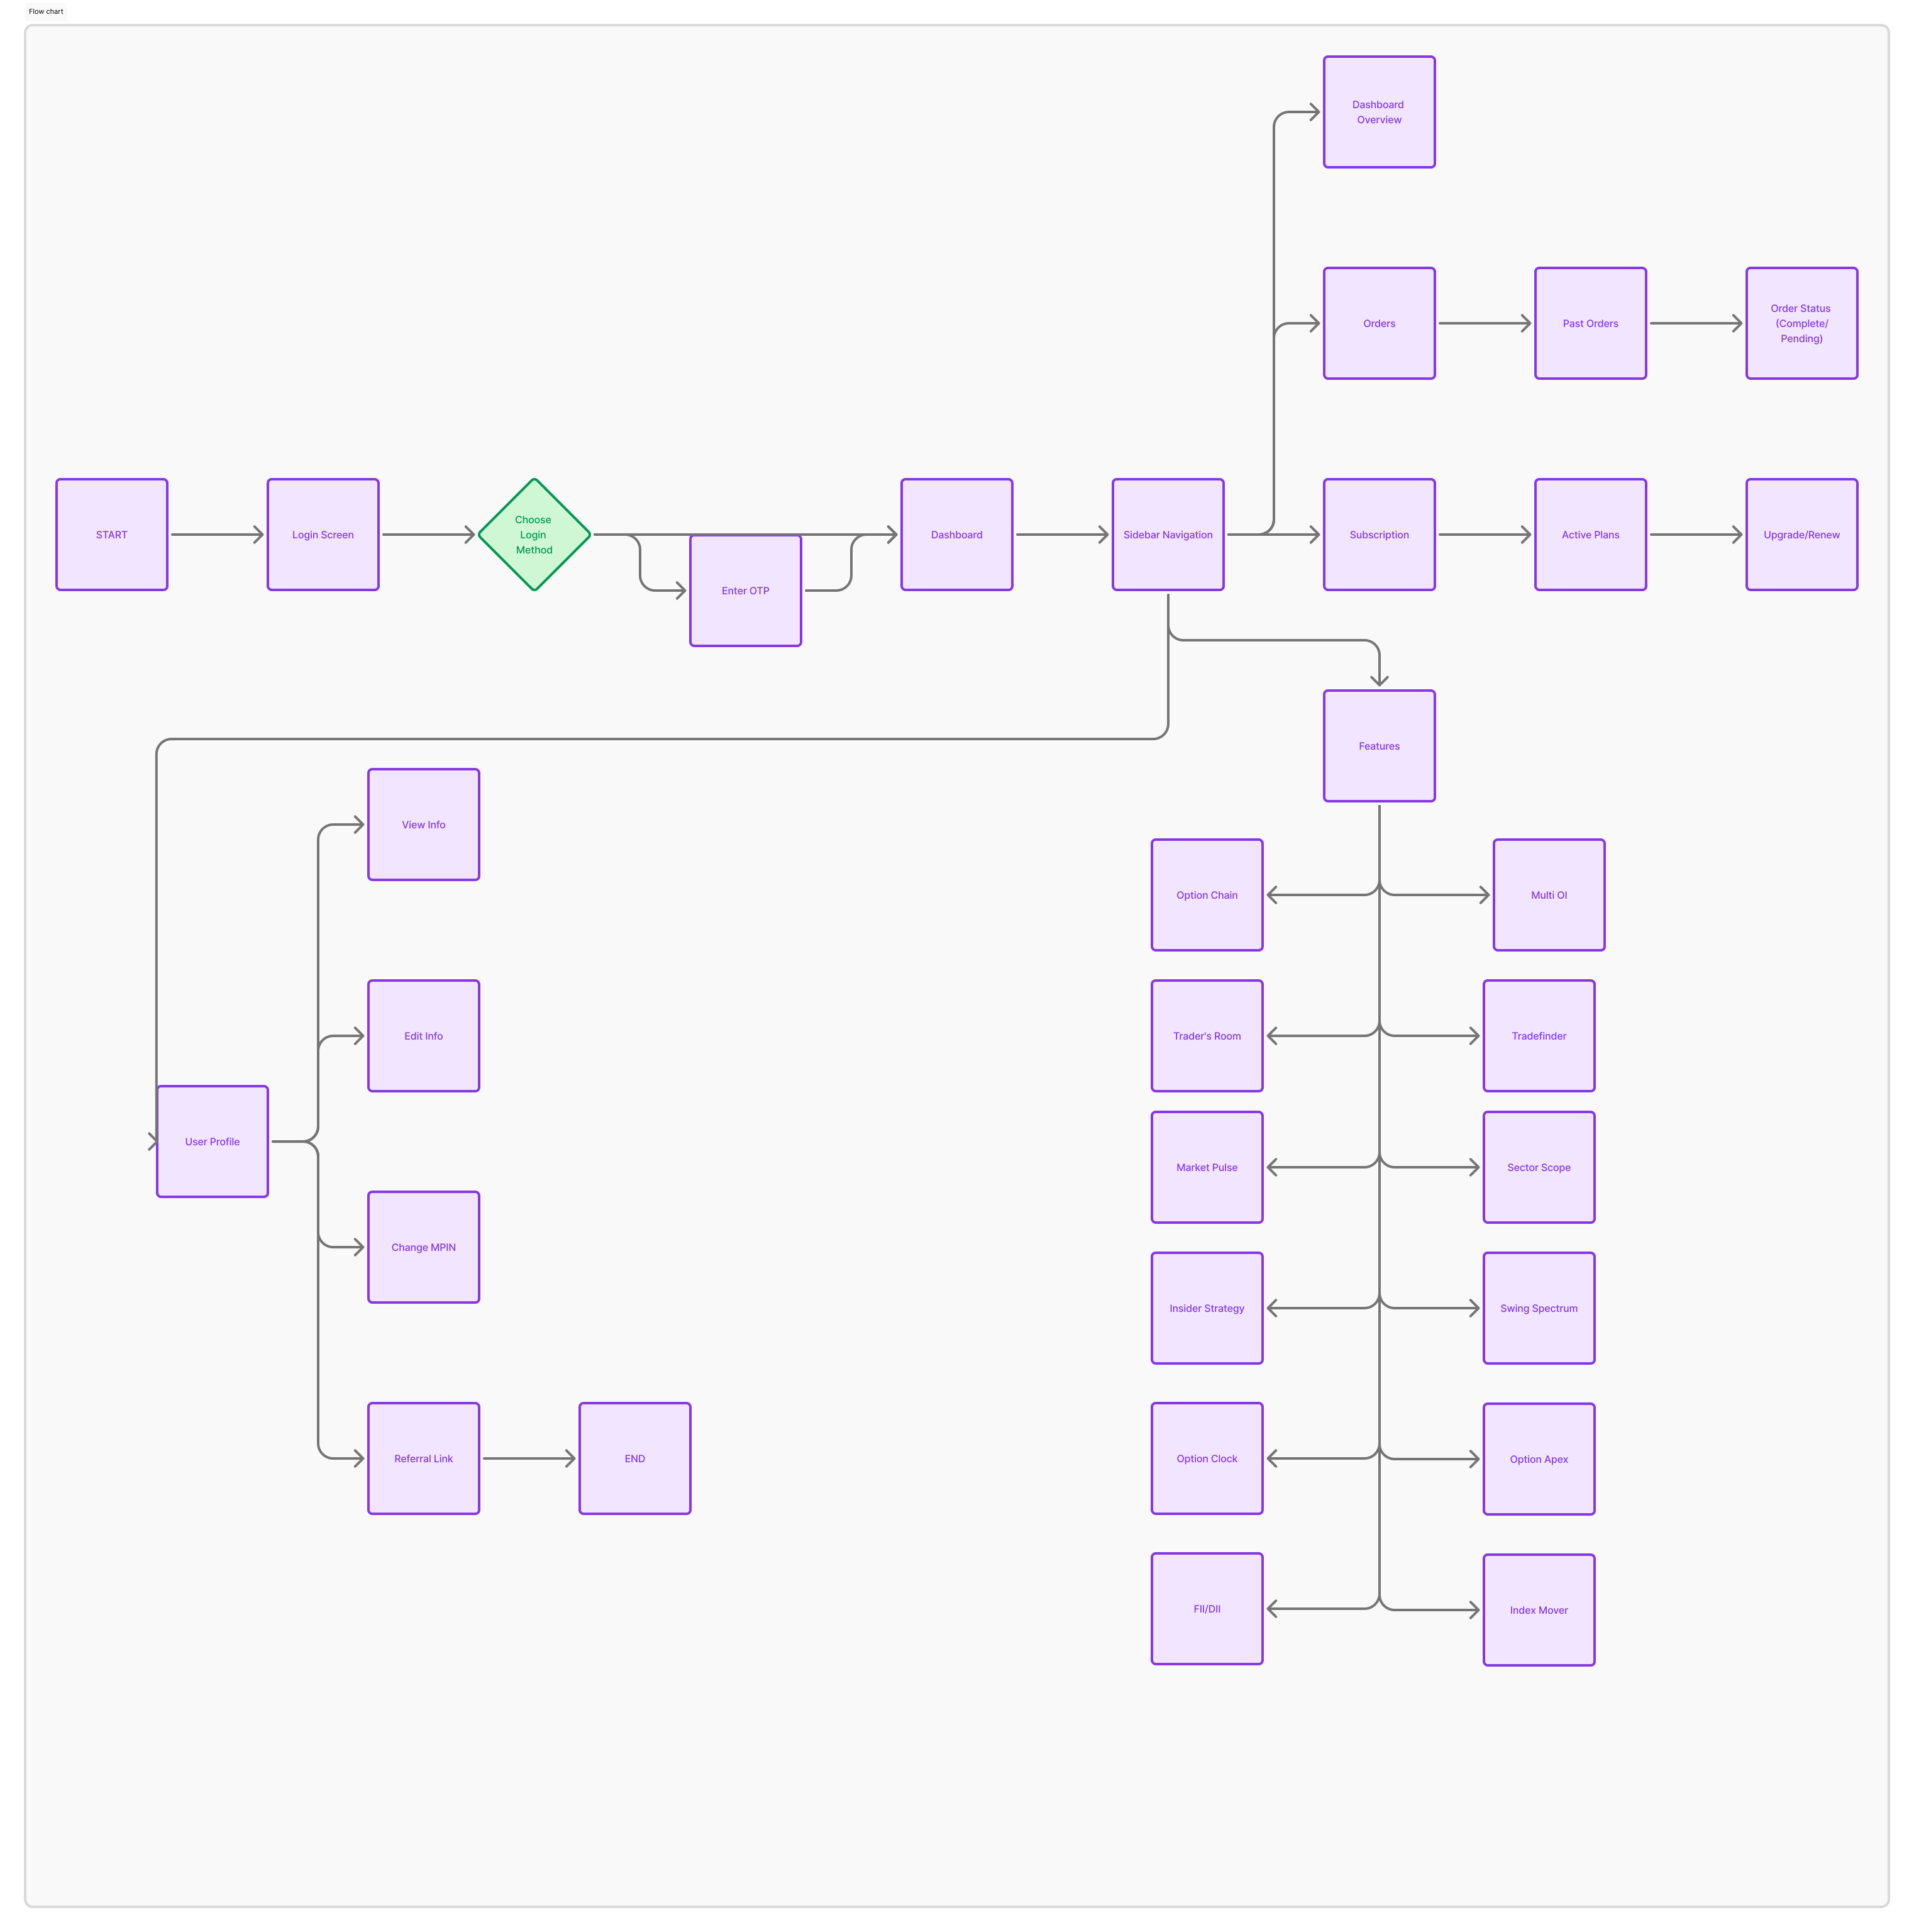
What I owned
Owned
- Product strategy, user flows, and information architecture
- Wireframes, interaction model, and high-fidelity UI
- Validation synthesis and iteration decisions
- Developer handoff with behavior states and edge cases
Collaborated
- PM on scope, sequencing, and KPI alignment
- Engineering on technical feasibility and state visibility
- Stakeholders on domain constraints and rollout priorities
Out of scope
- Backend implementation and infrastructure changes
- Pricing, growth campaigns, and sales operations
- Post-launch paid acquisition strategy
The results
38%
faster insight-to-action time
22%
fewer context switches per task
+19 pp
higher signal interpretation confidence
Traders interpreted signals faster with less cognitive friction. Deeper usage of high-value analysis modules. Improved decision speed supports retention in active cohorts.
The approach
I mapped the real task, insight to action, across every tool it currently spans, then designed the smallest single surface that could hold all of it.
Discover
Mapped user and business friction through interviews, workflow audits, and benchmark analysis.
Prioritize
Ranked opportunities by impact on activation, task success, and decision confidence.
Design
Built IA, interaction patterns, and high-fidelity solutions with clear state behavior.
Validate
Tested critical flows, measured drop-offs, and iterated before development handoff.
The decisions
The calls that shaped the product, with what each one cost. Anything crossed out here was a real option at the time.
Decision 1: Workspace model
Users relied on multiple panes with no clear priority.
Considered
- Keep split panes
- Unified command layout
- Preset-only templates
Chose
Unified command layout with context-aware side panels
Gave up
Initial learning curve for existing users
On what evidence
Task audits showed repeated lateral navigation
What happened
22% fewer context switches
Decision 2: Signal readability
Signals were visible but not decision-ready.
Considered
- Raw table
- Tiered confidence chips
- Tooltip-only detail
Chose
Tiered confidence chips with linked evidence
Gave up
More annotation metadata to maintain
On what evidence
Interviews flagged signal trust ambiguity
What happened
Confidence score improved by 19 points
Decision 3: Action placement
Action CTAs were detached from chart insight state.
Considered
- Global action bar
- Inline contextual actions
- Modal-driven actions
Chose
Inline contextual actions near decision points
Gave up
Higher UI state complexity
On what evidence
Heatmaps showed delayed click progression
What happened
Insight-to-action time dropped to 5.2 min
The work
One dashboard now carries chart, position and performance context together, so interpreting a signal and acting on it stopped being two different places.

Unified dashboard
Consolidate core tools to reduce context switching.

Signal layer
Make confidence and rationale legible at glance.

Action zone
Place high-priority actions where decisions happen.
Targets, set up front
Metric
Baseline
Target
Result
Measured in
Insight-to-action time
Baseline 8.4 min
Target <6 min
Result 5.2 min
workflow test
Context switches per task
Baseline 9
Target <=7
Result 7
session replay
Signal confidence score
Baseline 58%
Target 70%+
Result 77%
validation study
Outcomes in detail
Quicker market response
Lower interaction fatigue
Higher decision conviction
Reflection
What worked
Linking signal confidence to action context removed ambiguity.
What to improve
Add role-based workspace defaults for novice vs expert traders.
Next experiment
Test adaptive layouts based on market volatility state.


Vinit Chaudhary

I'll personally review your brief and get back to you within two hours.
Product Designer
Contact
I usually respond to all digital enquiries within 2 business hours.

Let's Work Together.
Reach out today and let's craft designs that elevate your brand to the next level.